
Dashboard
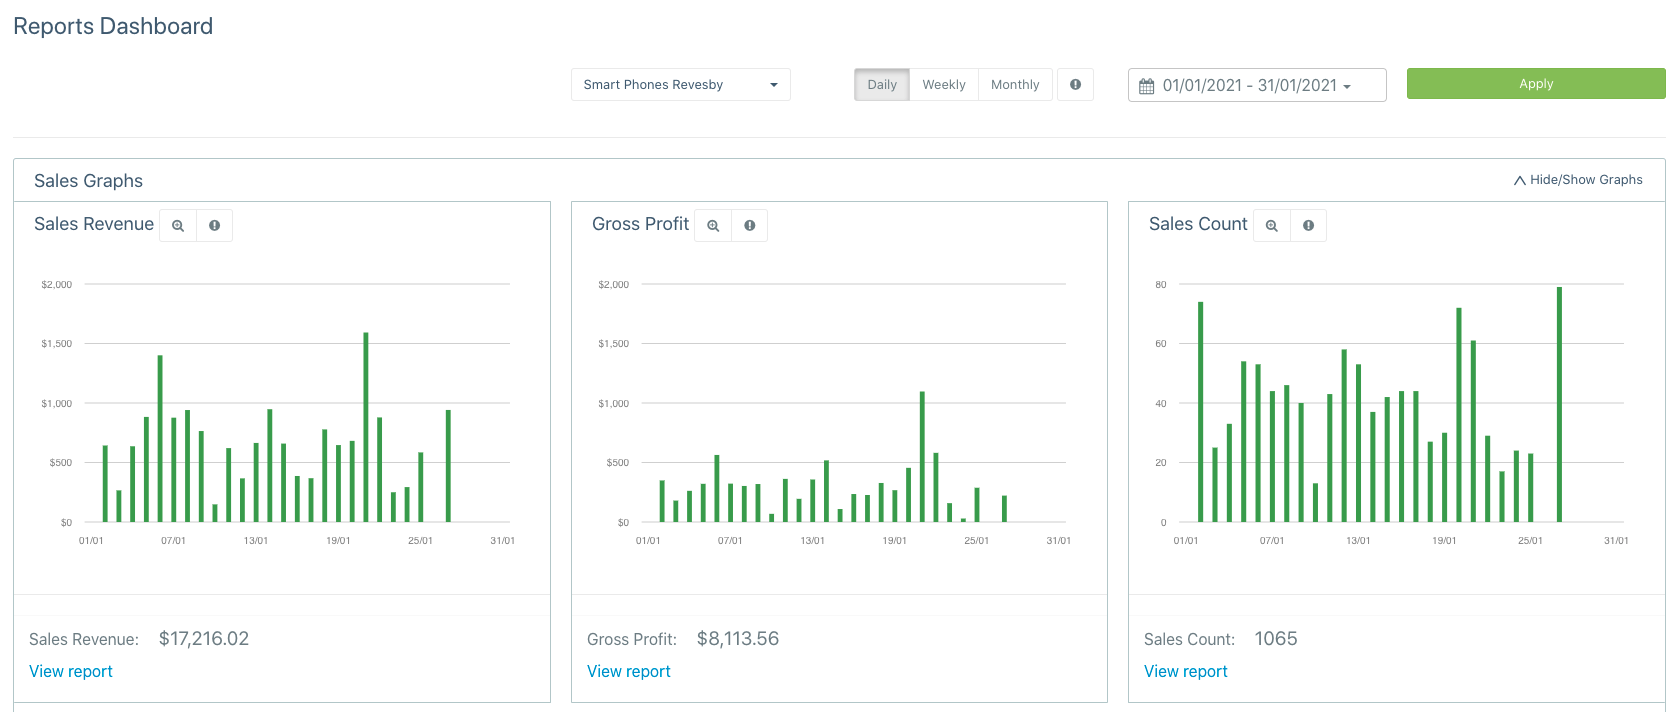
- The reports dashboard is your one-stop-shop for a summary of all your most important reports. Each report can be viewed in full-screen by clicking the magnifying glass next to each graph. The information icon to the right of that gives a brief explanation of the respective graph.
- If you would like to view where all the information for the graphs come from click on the "View Report" button and this will redirect you there.
- Across all graphs, there are controls for daily, weekly and monthly views, as well as a date range if you want to search for graphs between specific dates.
- If your company has multiple stores, there is also a drop-down list to select what store/stores you wish to view.
Reports Breakdown
Note: Most of the reports listed below are exportable in CSV, Xcel and PDF just click on the export button above the table.
Sales Reports
The sales reports were made to help you manage and monitor your daily, weekly, monthly or yearly sales such that you are able to set accurate targets for your staff.
There are many sales reports, below you can find a quick summary of what each is used for:
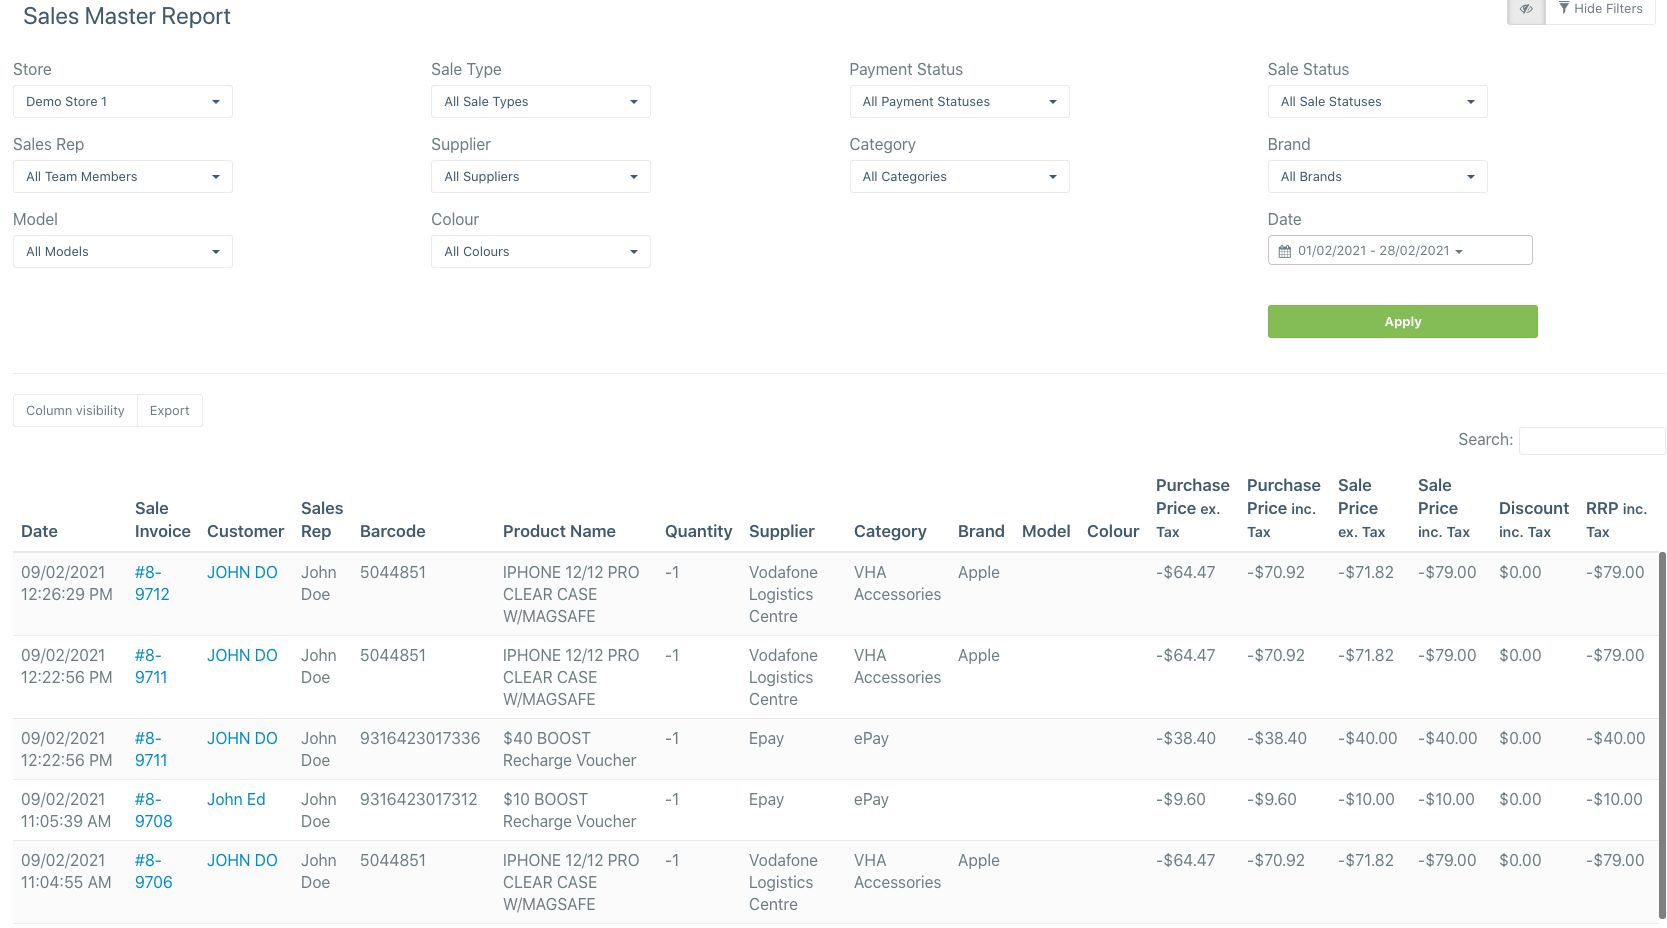
- Sales Master Report: This report provides you with an in-depth outlook on all the sales your company has made within the selected date range.
- Sales By User Report: This report details all of the sales made by specific staff in your selected date range.
- Sales Payment Methods Report: The sales payment methods report will show which payment methods are used for each sale, useful for tracking your stores most common payment methods
- Prepaid Sales Report: This report details all of the prepaid sales made by your store within the selected date range.
Top Selling Reports
The top-selling reports detail all of your top-selling items, these reports are very useful to have when replenishing your stock as it allows you to know how much of each product you should order.
Here is a breakdown of each of the top-selling reports:
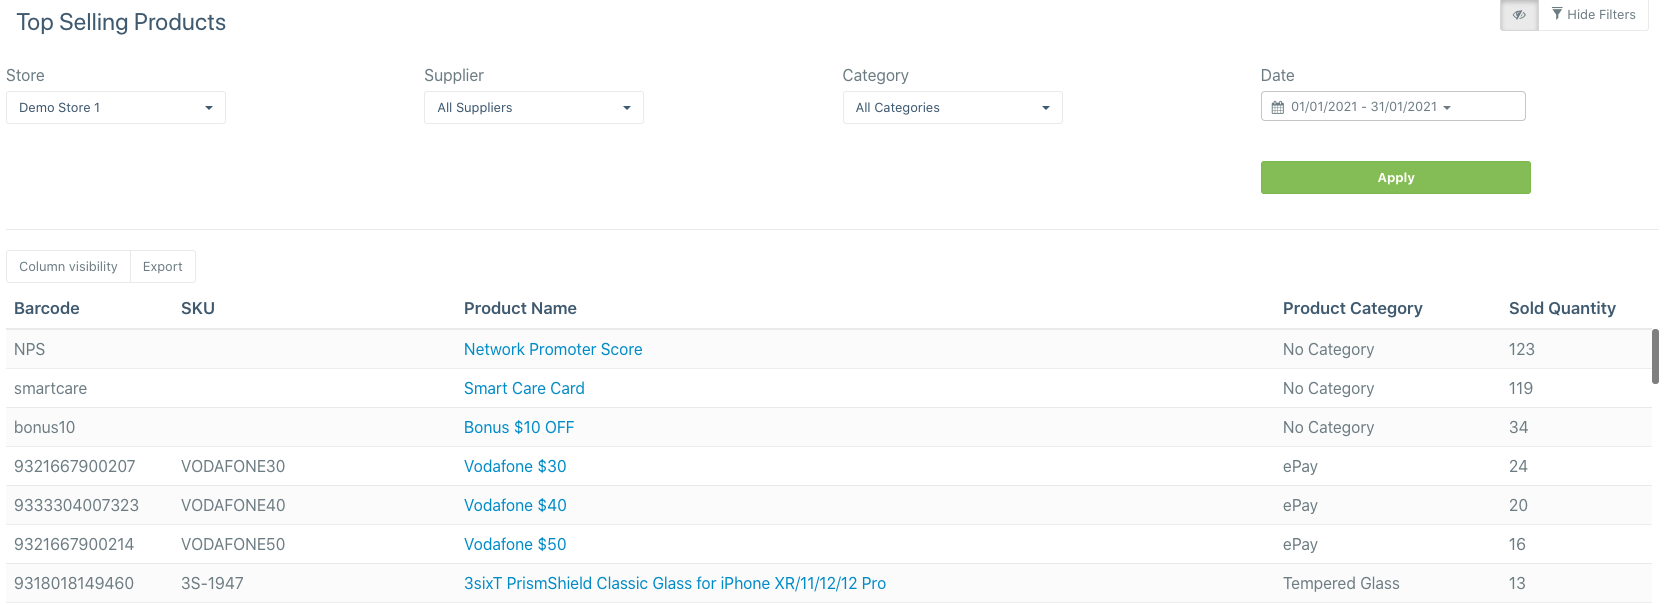
Top Selling Products Report: This report shows you all of your top-selling products per store
Top Selling Categories Report: This report details the top-selling categories per store e.g. ePay, Cases and Covers etc.
Top Selling Connections Report: The top-selling connections report shows you the most commonly sold connections per store
Top Selling Attached Devices Report: This report details the top-selling attached devices per store
Top Selling Deferred Devices Report: This report details the top-selling deferred devices per store
Stock Reports
The stock reports were made to help you manage your stock, including replenishment, ageing, holdings and history. These reports aim to help you know your stock better such that you don't over or under order products.
Below you can find a breakdown of the different reports:
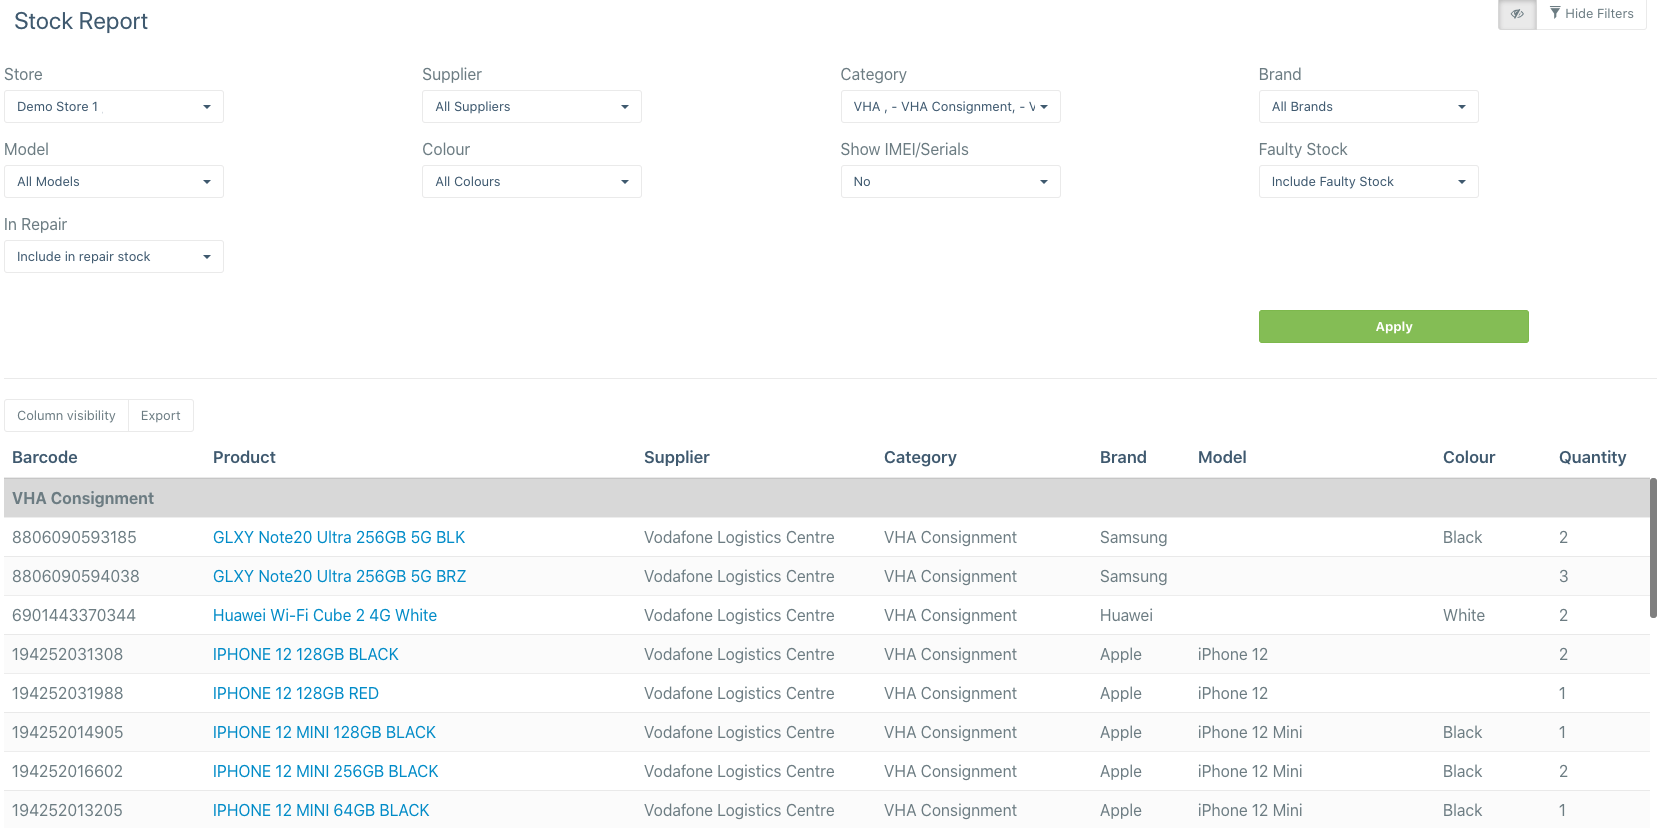
Stock Report (Stock Count Report): This report gives you a list of all the stock which is currently in your store(s).
It is commonly used to perform end of day devices count (Steps for this are shown below) another useful aspect of this report is the signature field which can be signed when you export it as a PDF. In this report, you can also choose to show or hide IMEI's before exporting so that you can maintain privacy.
End of day devices count steps:
- Select VHA or VHA Consignment as your category from the category filter and click apply
- Click on the export button and select the PDF option
- If you would like to print it click on the print icon in the top right of the screen
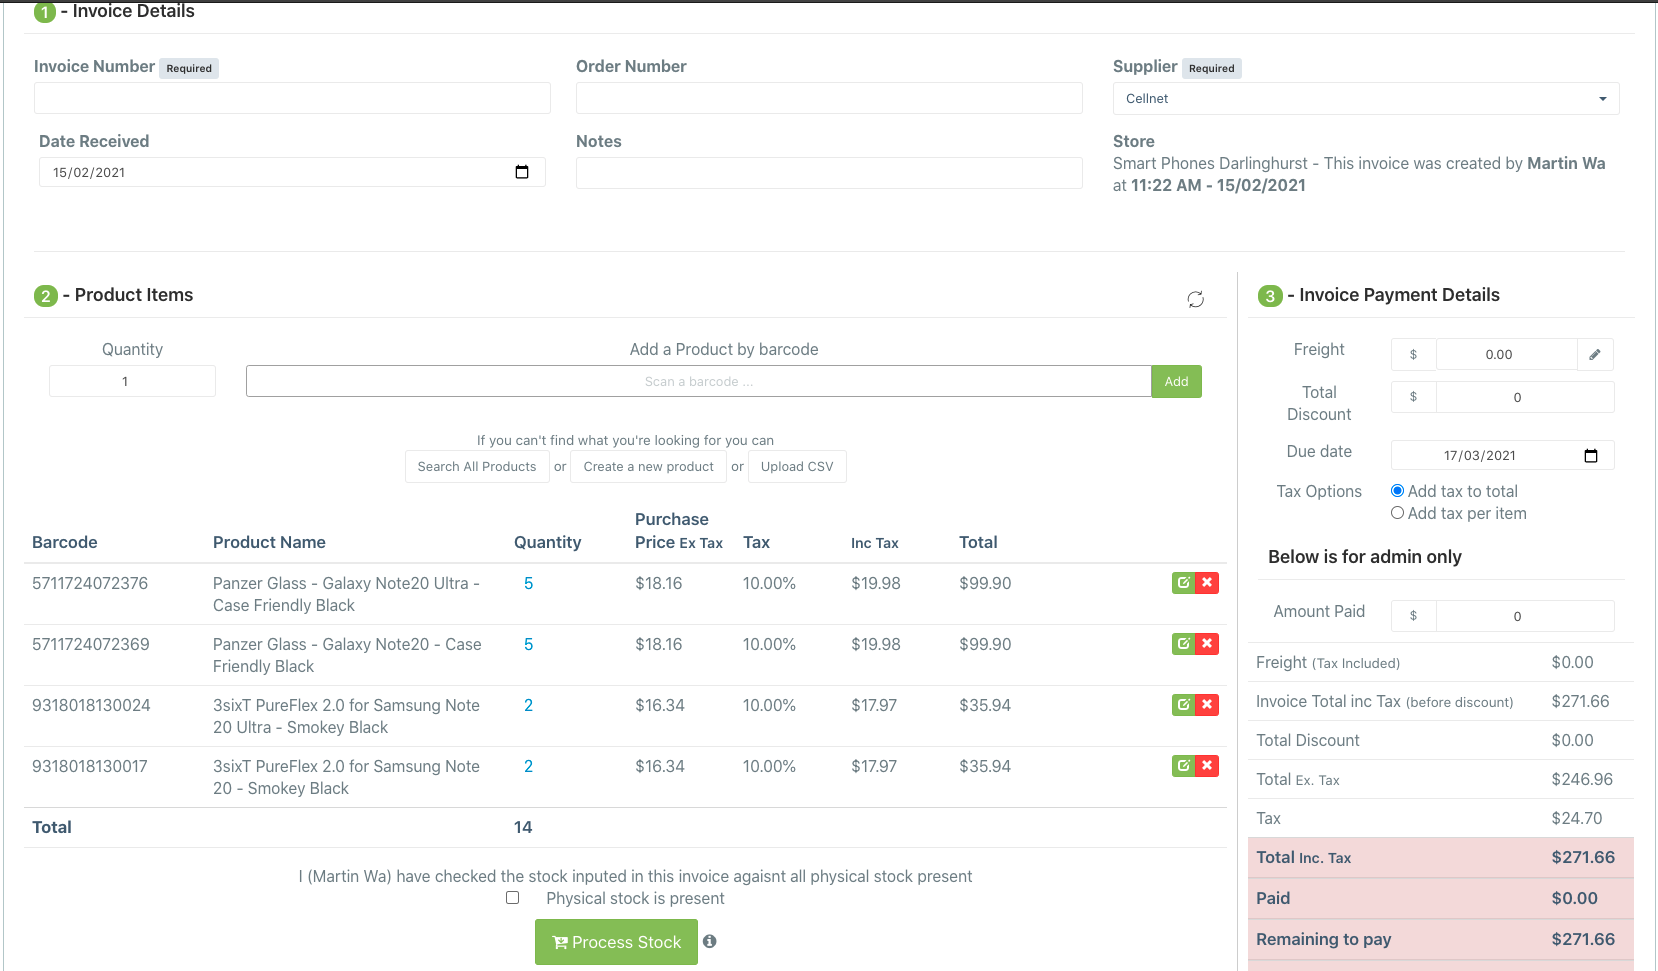
Stock Sold Replenishment Report: The stock sold replenishment report helps you stay on top of reordering stock which you sell frequently. It also helps you manage and maintain your stock levels in order to ensure that you are never understocked. This is possible because of our intuitive algorithm which knows how much stock to order based on stock on hand.
You can make an order for stock based on different suppliers by clicking on the create order button to the right of the export button. In order to select a supplier, enter one into the supplier filter above the table. After clicking create order you will be taken to a sale which has automatically adds the items to restock from there you can edit or complete the sale. See screenshot below
Stock Ageing Report: This report tells you the age of the stock which is currently in your store(s), this is calculated based on the date received in the different invoices. The stock ageing report is very useful as it can help you manage your time with returns such that if you need to return products to VHA before the end of the 60 day consignment period
Stock Holdings Report: This report details the value of the stock currently in your store(s), which is very helpful when performing calculations for EOFY.
Stock History Report: The stock history report shows you everytime a specific product has been sold, including the sale details. In order to utilise this report you need to enter in the barcode of a product into the barcode field above the table.
Products Recieved Report: This report details all of the products which have been ordered and recieved by staff.
Profit Reports
The profit reports are very helpful when calculcating how much profit your store(s) have made and which user, category or connection is most profitable for your store(s).
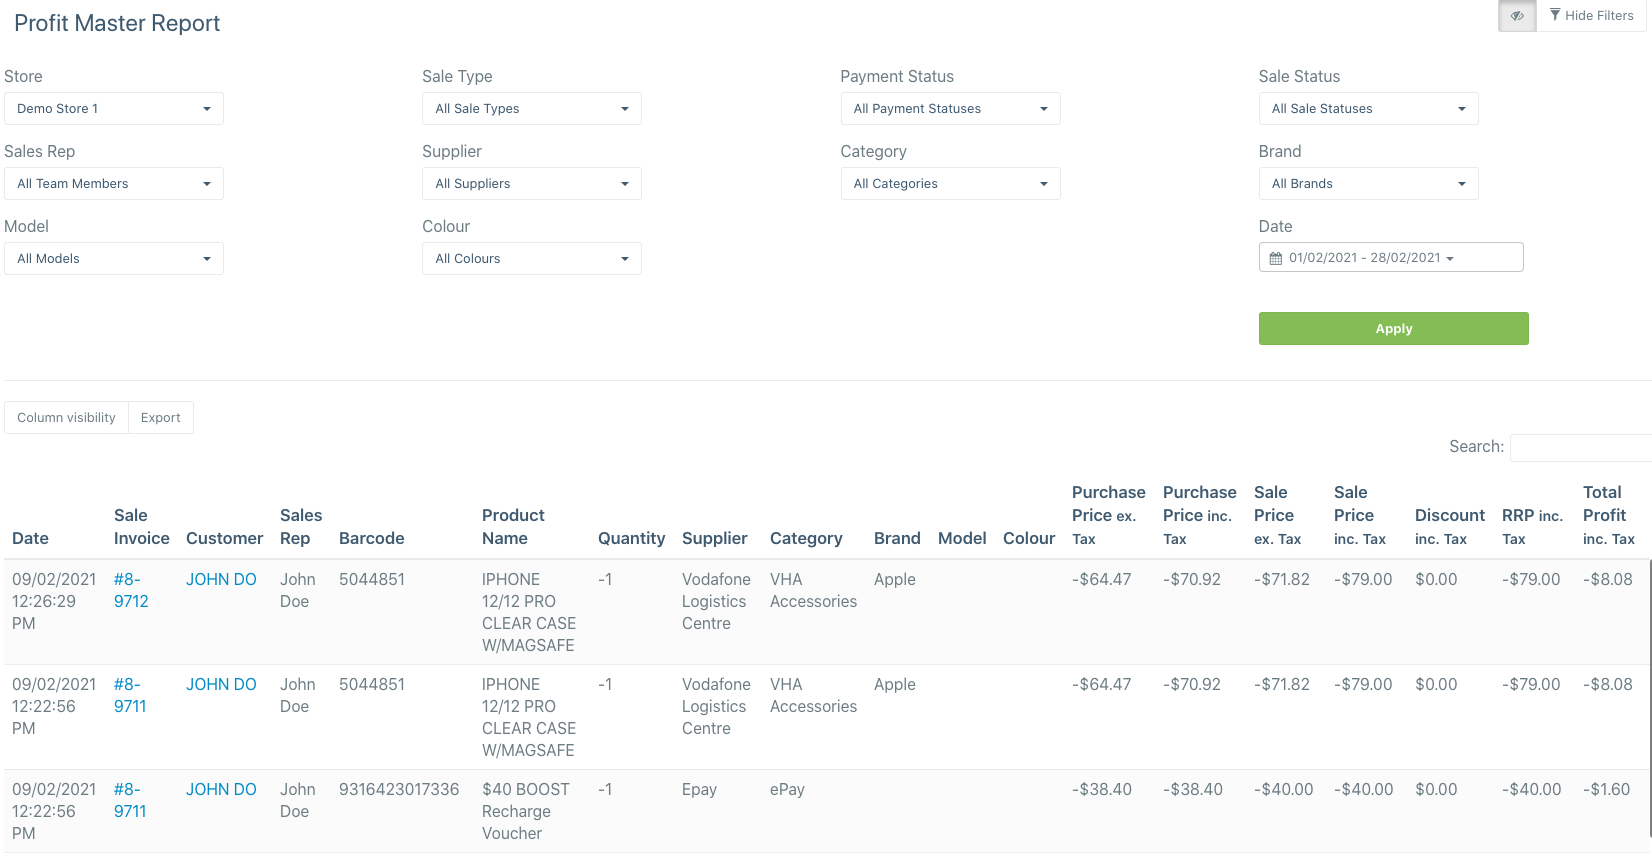
Profit Master Report: This report shows the profit made on all outright sales sold in the system within a specific date range.
Profit By User Report: The profit by user report details all of the profits from the sales made by specific users, including the sale details themselves.
Profit By Category Report: This report details the profit made on sales of different category types such as ePay, cases and covers or VHA Accessories.
VHA Connections Profit Report: This details the profit made on connections sales by different staff members in your store(s).
Sales and Connections Profit Report: The sales and connections profit report includes the profit made on outright sales and expected upfront commisions/insurance bonuses.
Connections Report
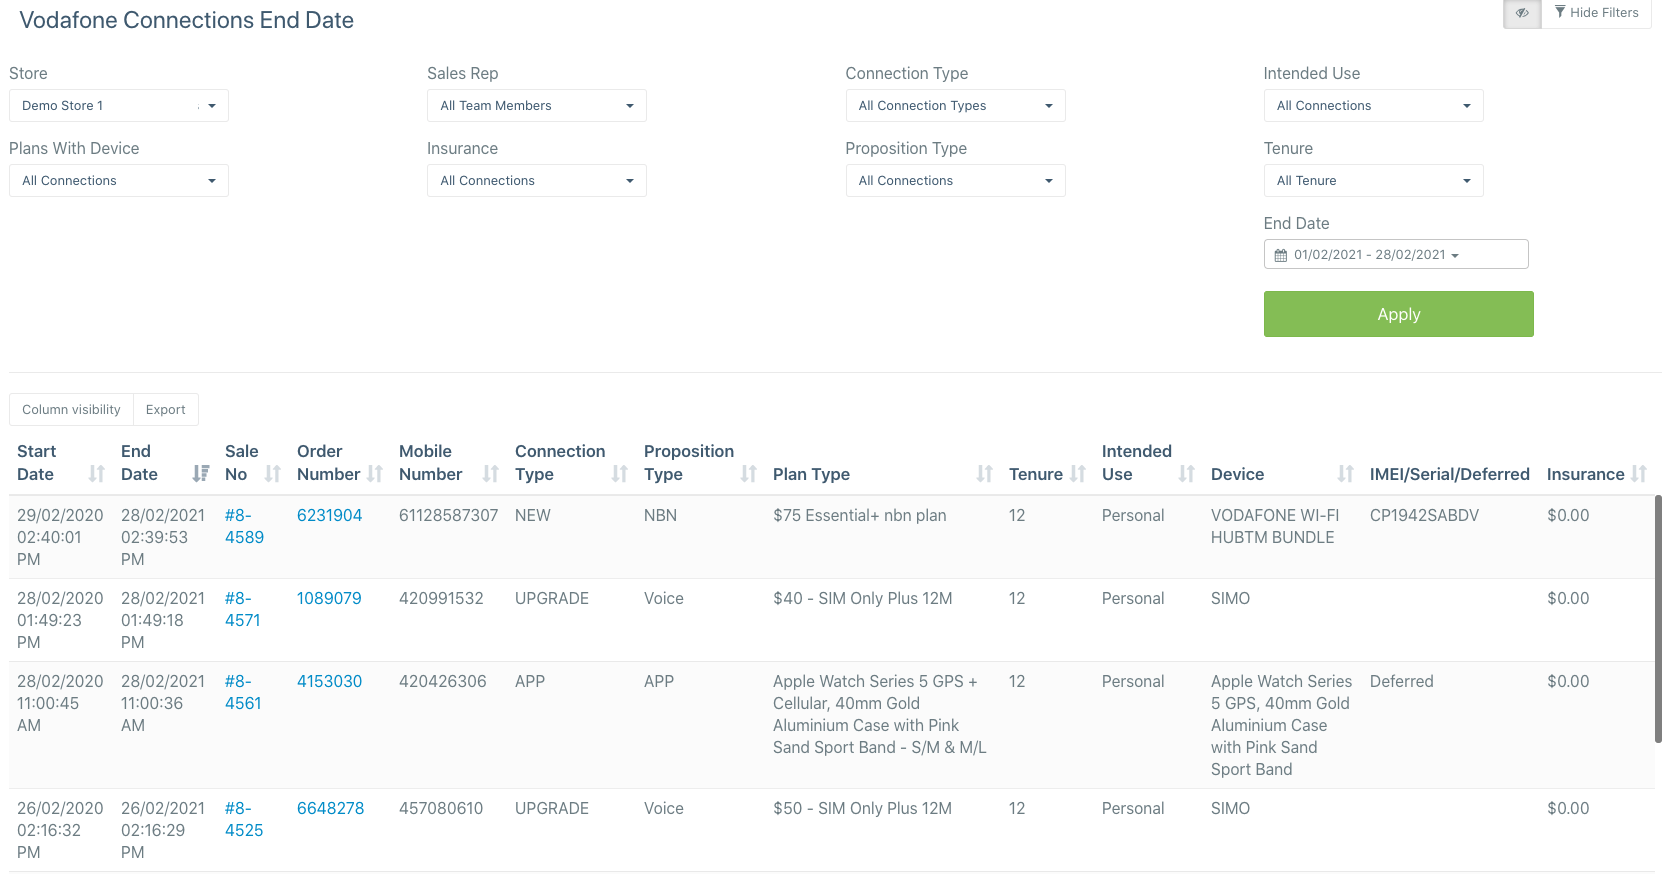
Connections End Date Report: The connections end date report shows you when connections made by your store(s) will end sorted by the closest end date. This report is helpful for contacting previous customers and asking them if they would like to renew or purchase a new plan with your store
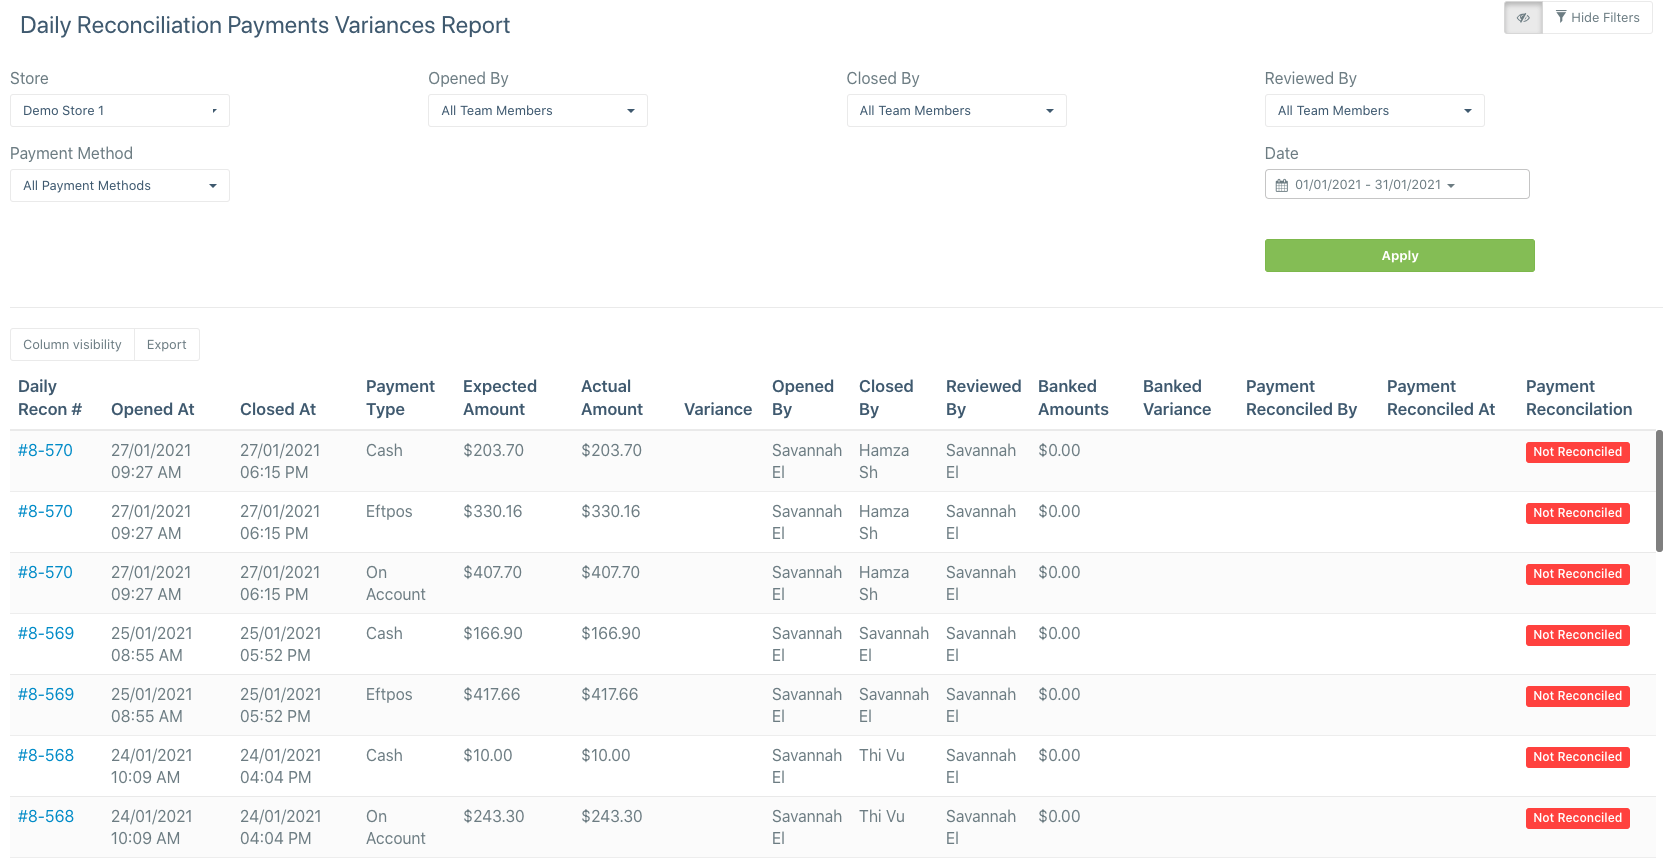
Daily Recon Report
This report details the expected and actual amounts summed up through sales in daily reconciliations. The difference between the expected and actual amount can be found in the variance column. This report is very helpful in finding and rectifying discrepancies in the money which should've been made.
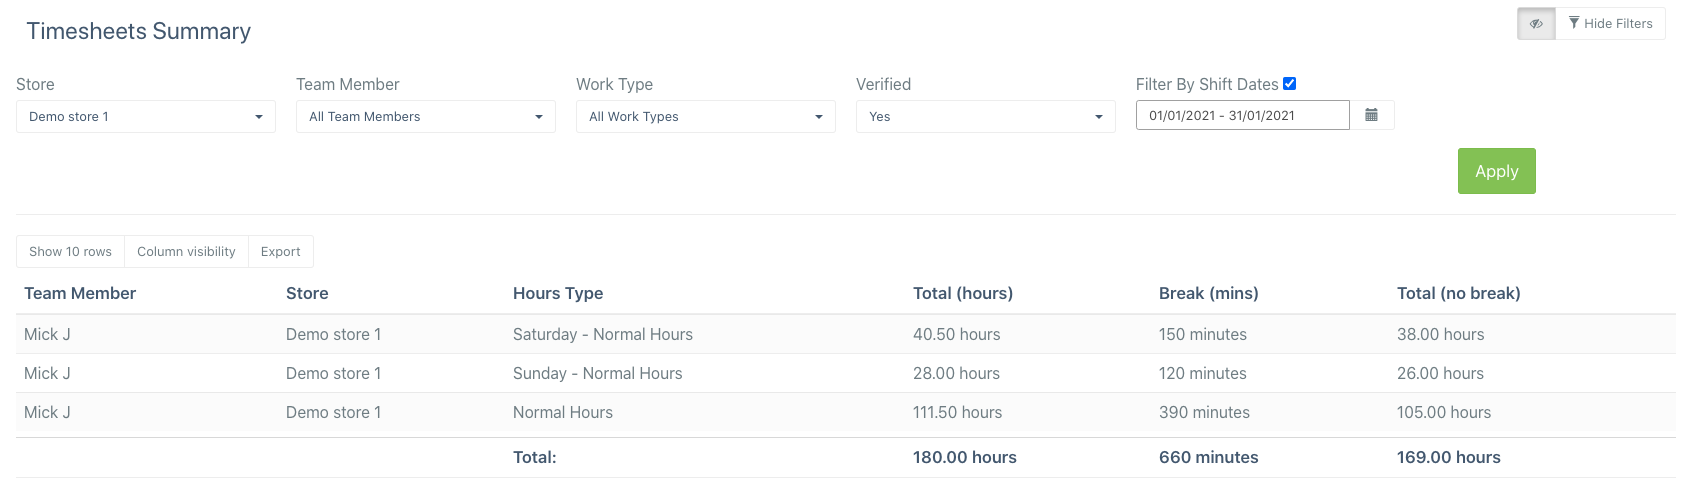
Timesheets Report
Note: This report groups by team members, stores and work types.
The timesheets report shows a summary of all the hours worked by different team members within the selected time period.
Comments
0 comments
Please sign in to leave a comment.